Development of Confocal micro-PIV System for Measurement of the Interaction between Red Blood Cells and Surrounding Flow
Red blood Cell (RBC), a main component of blood, has a bi-concave shape, a membrane and; therefore, a high deformability. In micro-circulation, it is known that RBCs’ unique behaviors such as axial migration, tank-tread motion, and tumbling motion cause a reduction of flow resistance. However, it is unclear the interaction between RBCs and their surrounding flow during RBCs unique behaviors.
In order to understand the interaction between RBCs and the surrouding flow, following measurement’s conditions are necessary
1 in Vitro measurement
2 high spatial resolution measurement
3 continuous, long time measurement
Recently developed confocal mico-PIV makes it possible to measure micro-flow with a high spatical resolution, but it has a limitation on measurable speed range. In addition, RBCs’ size(about 8μm) makes continuous, long time measurement difficult. Thus, the proper technique for measurement of the interaction between RBCs and the surrouding flow has not established yet.
In this research, we solved these problems by building a microscopic motorized stage into the conventional confocal micro-PIV system. We called our developed measurement system as “Object chasing type confocal micro-PIV measurement system”. Applying this system and multi-color units, which allows to measure two different phase simultaneously, we measured RBCs and surrounding flow at the same time in micro channel and discussed the interaction between them.
The measurement system is shown in Fig1.Two different lasers excite fluorecent particles attached on RBC’s membrane and different color fluorescent particles in flow, and their PIV images are stored in two different cameras.
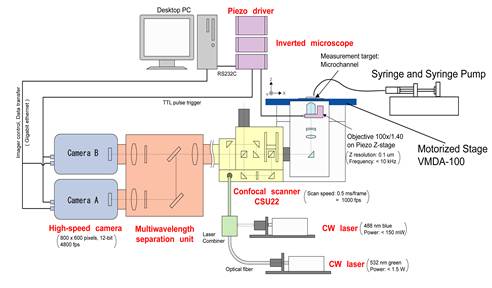
Fig.1 measurement system
PIV images of RBC’s membrane and surrounding flow are shown in Fig2, 3, respectively. In the images, RBCs are marked in red circles. In Fig2, the position of RBCs in flow is clearly recognized by fluorescent particles on the membrane.
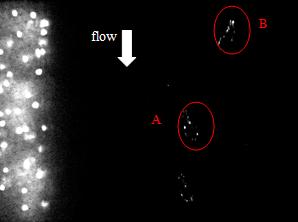
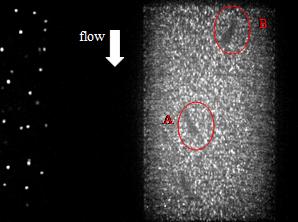
Fig2 PIV image (RBC: t=0.04s) Fig3 PIV image(surrounding flow: t=0.04s)
Time series images of RBC A are shown in Fig 4. Since positions of tracer particle differ without deformation of RBC’s shape, it is possibly to say that this RBC is conducting tank-tread motion. Thus, with our developed system, we succeeded on observing the tank-tread motion.
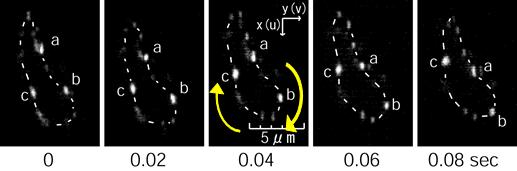
図4 time-series images of tracer particles on RBC membrane(RBC A)
Distributions of flow velocity v around tank-treading RBCs at t =0.04, 0.08s are shown in Fig 5,6, respectively. Difference of velocity magnitude at region A and B are observed.
Relative velocities of RBC membrane and surrounding flow respect to the center of mass of RBCs are shown in Fig 7. It is observed that surrounding fluids flows along the RBC’s shape.
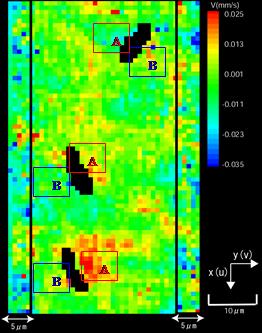
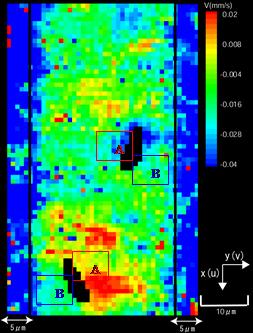
Fig 5 distribution of velocity v (t=0.04s) Fig 6 distribution of velocity v (t=0.08s)
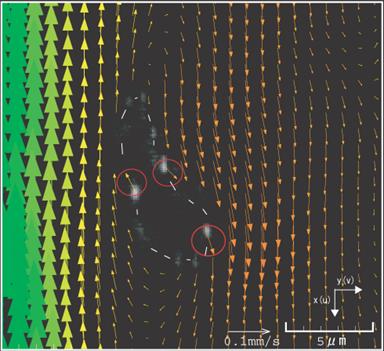
Fig 7 relative velocity of RBC membrane and surrounding flow respect to the center of mass of RBC (RBC A, t= 0.04s)